When you create a sketch, you may need to choose some numbers to produce the effect that you want.
Sometimes you can calculate the numbers, or copy the numbers from somewhere else (for example, if you find a color in an image or on the web). However, sometimes figuring out the numbers is a process of trial and error.
The slow way to do this is to enter one number into the program code, run the sketch, modify the code to use a different number, run the sketch again, and repeat until you find something that you like.
A quicker way is to yoke the parameter value to mouse position. Then you can move the mouse to the position that produces the effect that you want, get the value that was produced by that position, and use that in your code.
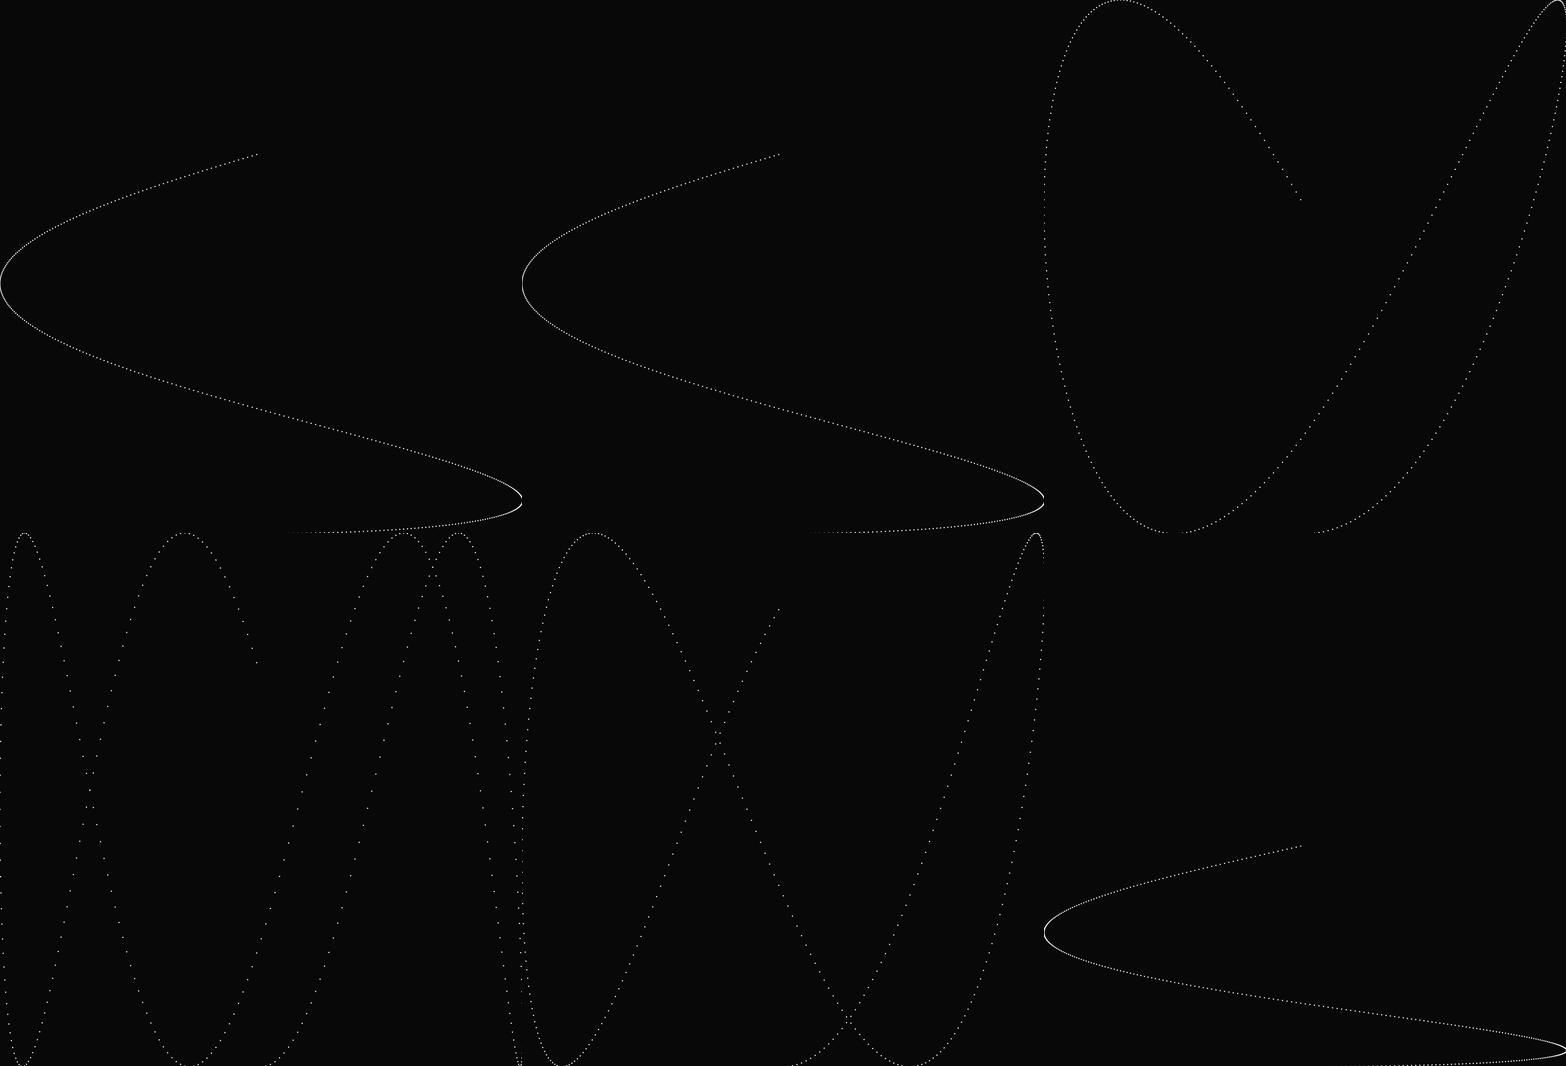
Here's an example using the Lissajous curve. This curve generalizes the use of sin() and cos() to produce a circle, to produce different curves that loop back and forth different numbers of times.
function setup() {
	createCanvas(windowWidth, windowHeight);
	angleMode(DEGREES);
}

function draw() {
	background(10);
	translate(width / 2, height / 2);
	noStroke();

	let ratio = 1;
	for (let angle = 0; angle < 360; angle += 1) {
		let x = width / 2 * sin(angle);
		let y = height / 2 * cos(ratio * angle);
		circle(x, y, 2);
	}
}
1. Editing Code
Let's edit the code to use a different value for ratio:
function draw() {
	background(10);
	translate(width / 2, height / 2);
	noStroke();

	let ratio = 1/2;
	for (let angle = 0; angle < 360; angle += 1) {
		let x = width / 2 * sin(angle);
		let y = height / 2 * cos(ratio * angle);
		circle(x, y, 2);
	}
}
And a third value:
function draw() {
	background(10);
	translate(width / 2, height / 2);
	noStroke();

	let ratio = 3/2;
	for (let angle = 0; angle < 360; angle += 1) {
		let x = width / 2 * sin(angle);
		let y = height / 2 * cos(ratio * angle);
		circle(x, y, 2);
	}
}
2. Driving a value from the mouse position
Now, modify this to drive ratio from the mouse x position. This allows us to scrub the mouse left and right, in order to rapidly explore a range of values.
function draw() {
	background(10);
	translate(width / 2, height / 2);
	noStroke();

	let ratio = map(mouseX, 0, width, 1/5, 5/1);
	for (let angle = 0; angle < 360; angle += 1) {
		let x = width / 2 * sin(angle);
		let y = height / 2 * cos(ratio * angle);
		circle(x, y, 2);
	}
}
The missing piece is that need to be able to find out what numbers looked good. There are three ways to do this:
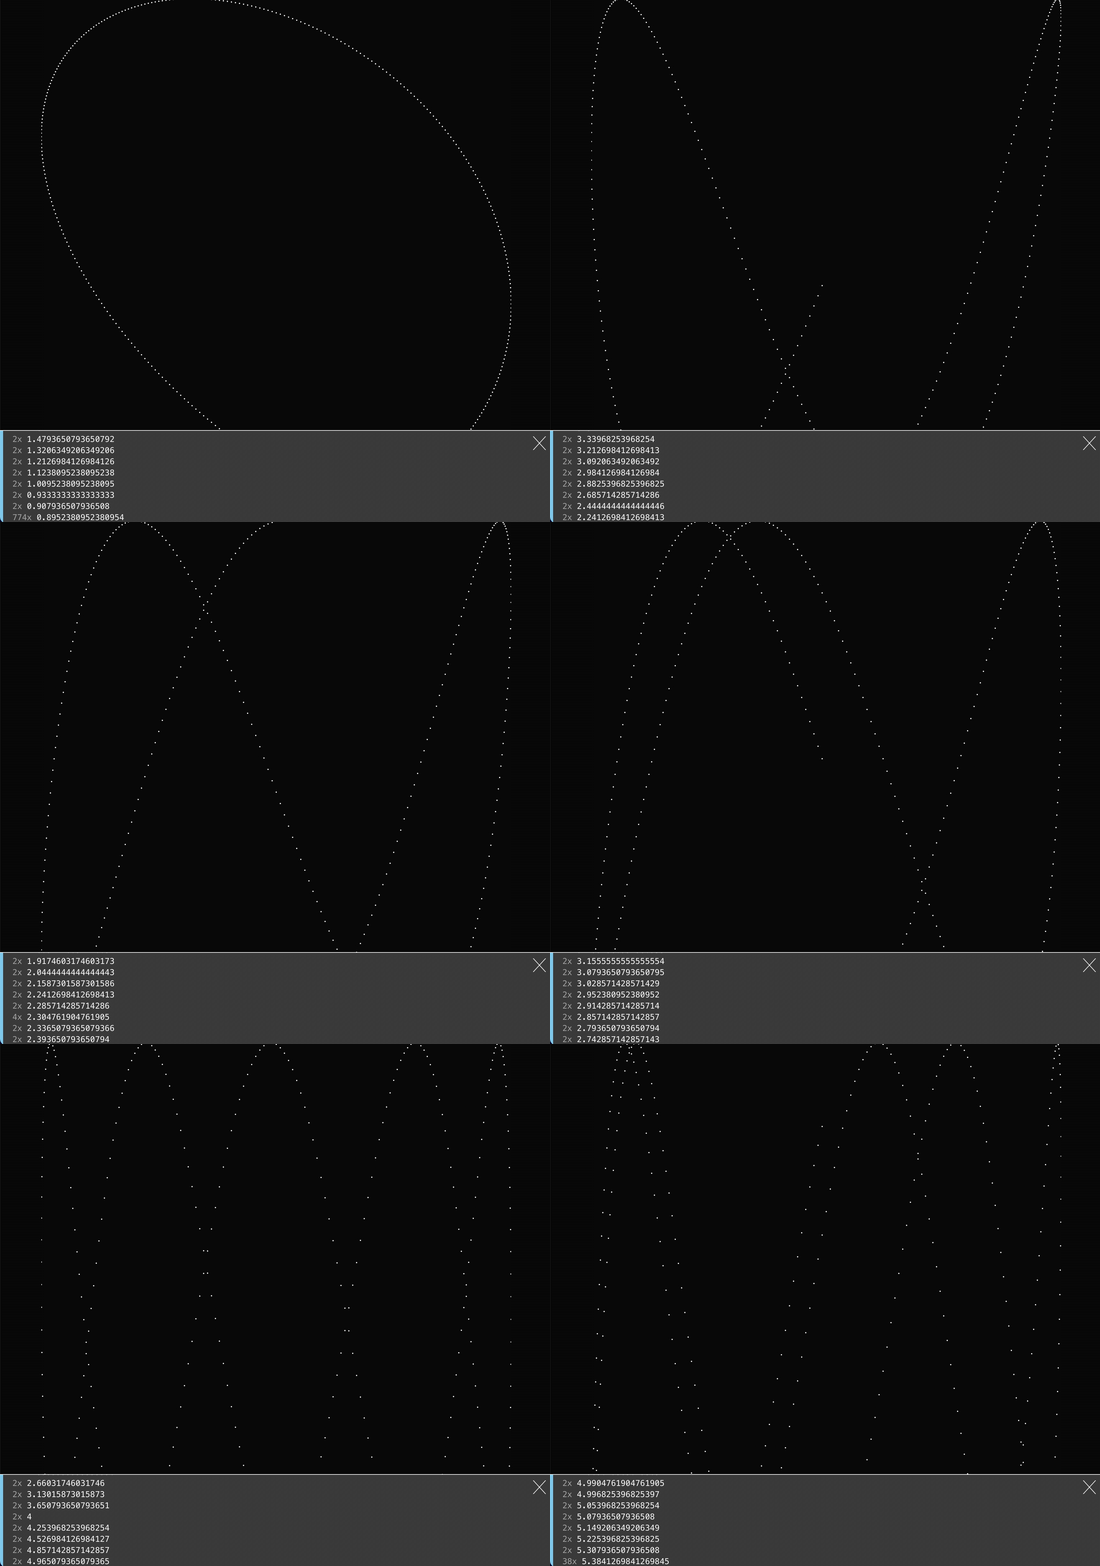
Print all the values to the console:
function draw() {
	background(10);
	translate(width / 2, height / 2);
	noStroke();

	let ratio = map(mouseX, 0, width, 1/5, 5/1);
	console.info(ratio);
	for (let angle = 0; angle < 360; angle += 1) {
		let x = width / 2 * sin(angle);
		let y = height / 2 * cos(ratio * angle);
		circle(x, y, 2);
	}
}
Print a value to the console when we click the mouse. (In order for this to work, the value has to be a global variable, so that mousePressed() can read the variable that draw() sets.)
let ratio;

function draw() {
	background(10);
	translate(width / 2, height / 2);
	noStroke();

	ratio = map(mouseX, 0, width, 1/5, 5/1);
	for (let angle = 0; angle < 360; angle += 1) {
		let x = width / 2 * sin(angle);
		let y = height / 2 * cos(ratio * angle);
		circle(x, y, 2);
	}
}

function keyPressed() {
		console.info(ratio);
}
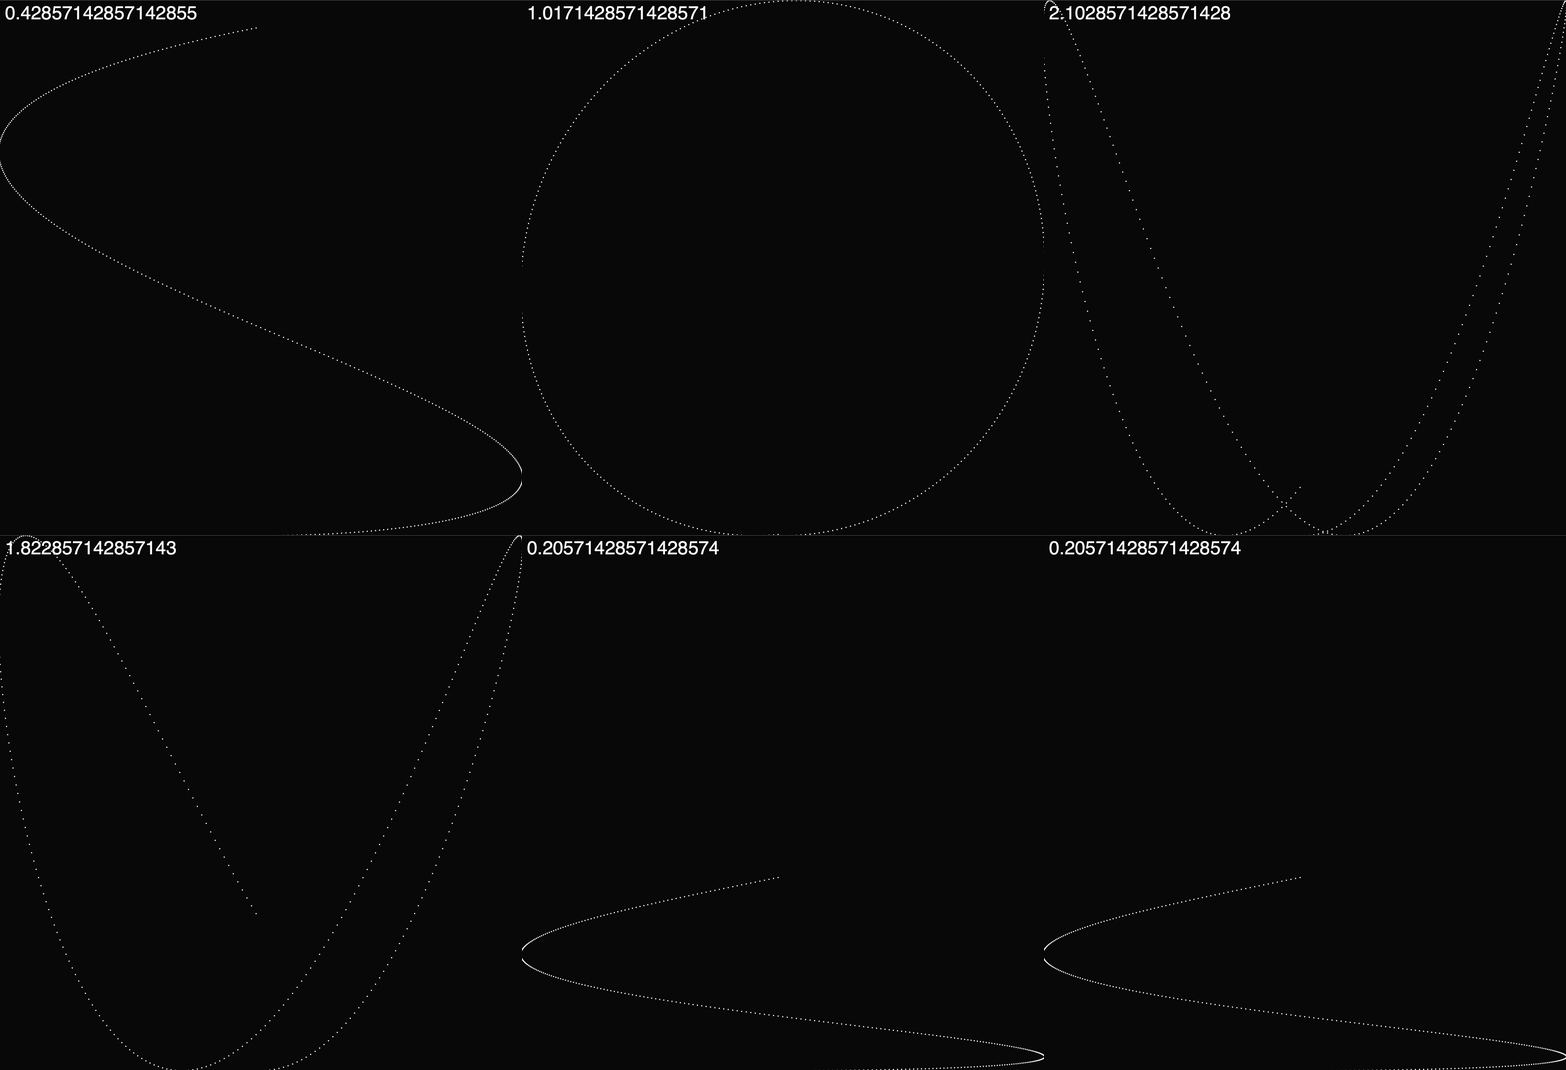
Use text() to display the value directly on the canvas:
function draw() {
	background(10);
	noStroke();
	fill('white');

	let ratio = map(mouseX, 0, width, 1/5, 5/1);

	push();
	textSize(30);
	text(ratio, 10, 30);
	pop();

	translate(width / 2, height / 2);
	for (let angle = 0; angle < 360; angle += 1) {
		let x = width / 2 * sin(angle);
		let y = height / 2 * cos(ratio * angle);
		circle(x, y, 2);
	}
}