Processing and Animation
Consider this sketch. What does it do? Try to figure it out by reading, and by running it.
void setup() {
 size(400, 400);
}

void draw() {
  background(220);
  noStroke();
  fill(255, 0, 0);
  circle(100, 100, 50);
}
There are several possible answers, from less to more specific:
- It draws something.
- It draws a shape.
- It draws a circle.
- It draws red circle over a gray background.
- It draws red circle over an 86% (220 / 255) gray background.
- It repeatedly draws: an 86% gray background, and a red circle on top.
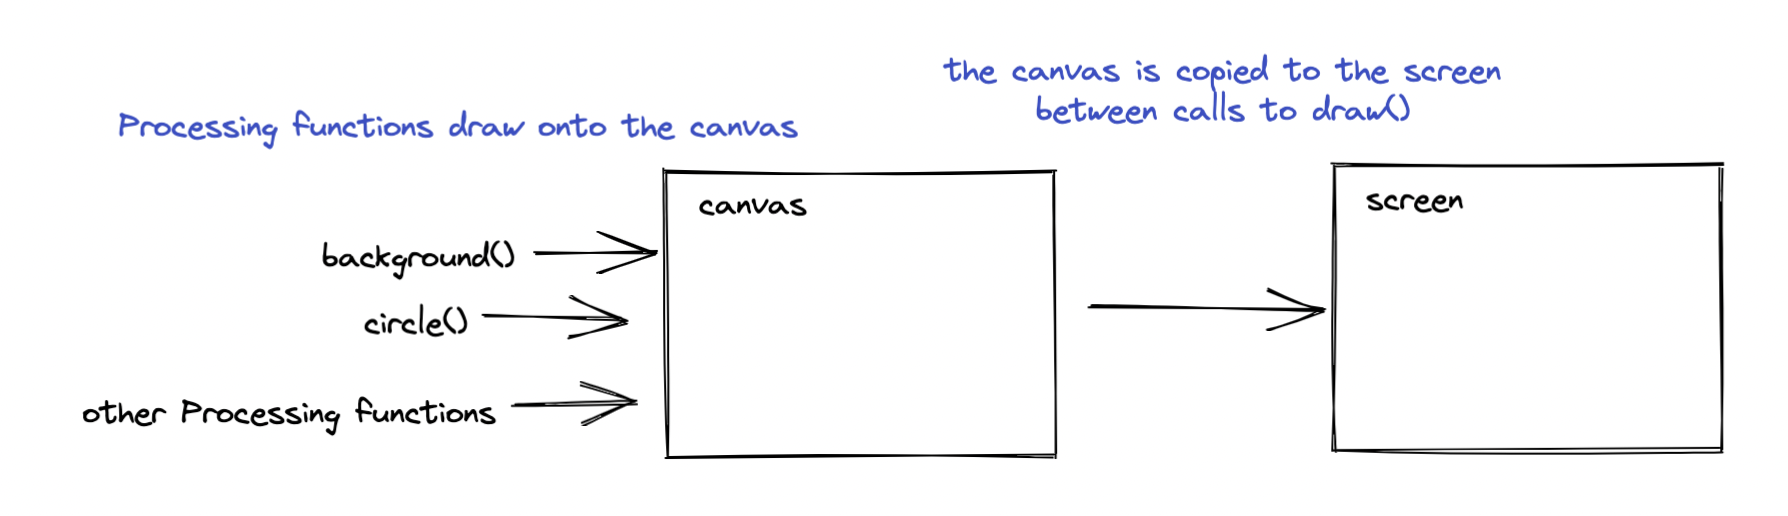
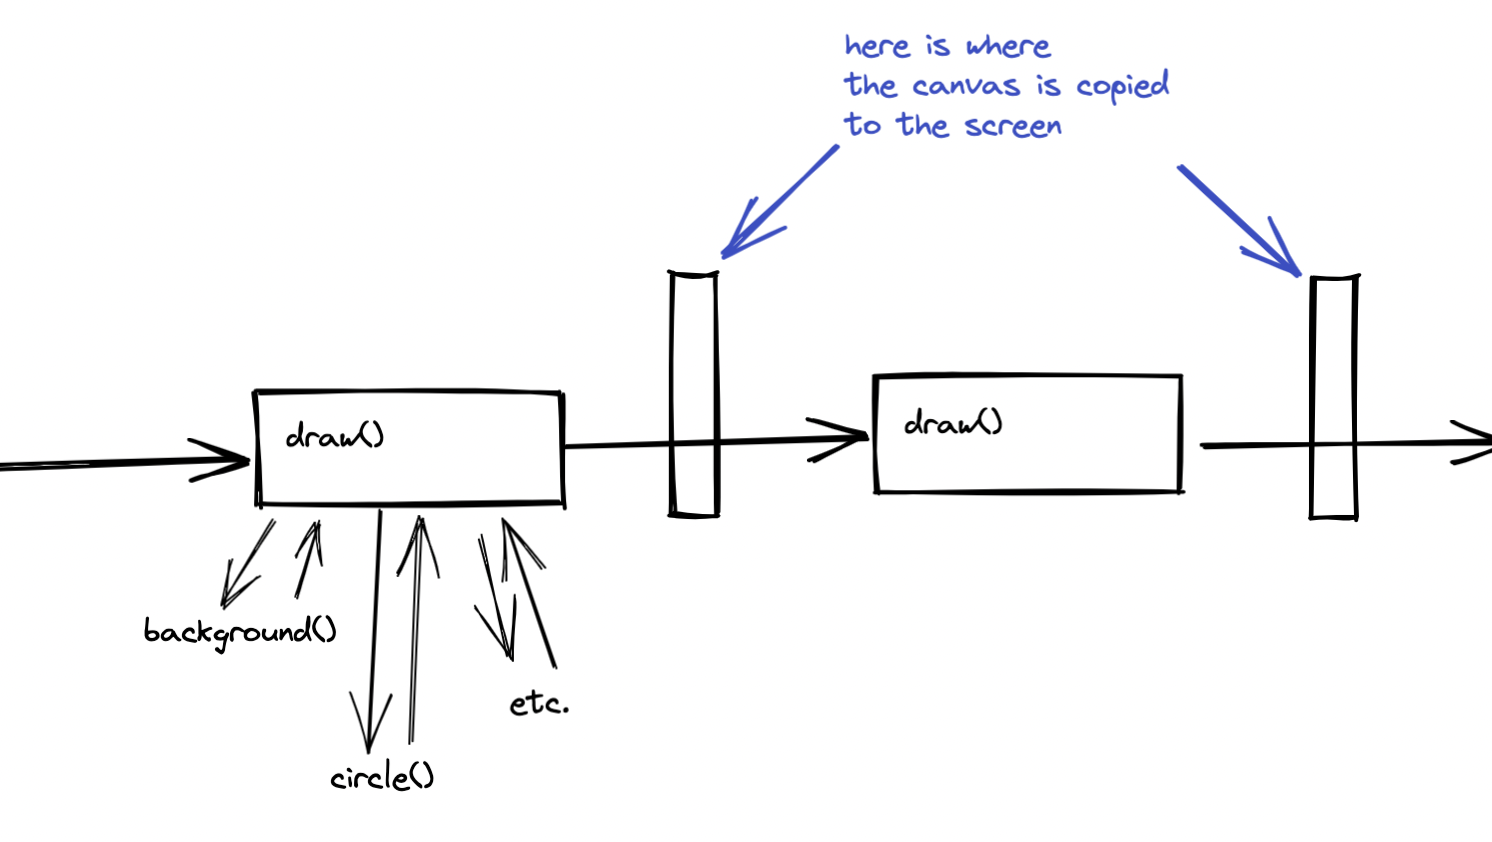
Take particular note of the difference between descriptions #5 and #6. This sketch draws the background and then the circle over and over again. It does this because the instructions to do this are inside of draw(), and Processing calls (runs) draw() over and over again.
Also note that at no time do we see just the background, without the circle. This is because the execution model for Processing looks like this:
Now consider this modification.
int x = 100;
void setup() {
size(400, 400);
}
void draw() {
background(220);
noStroke();
fill(255, 0, 0);
circle(x, 100, 50);
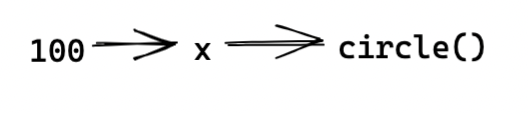
}This has exactly the same behavior. It has a different implementation. In the new sketch, the horizontal (x) position of the circle is the value of the x variable.
x is a variable that we defined. Because we define it at the top of the sketch, we can use it in setup() and draw().
There are a few variables that Processing itself defines. Consider this modification, that removes the definition of x, and changes the call to circle() to use mouseX instead of x. mouseX is one of the variables that Processing defines – this is why we can use it without defining it ourselves. You can read about what it does in the Processing reference, but you can probably also figure this out by interacting with the sketch. (Hint: move the mouse over the sketch window.)
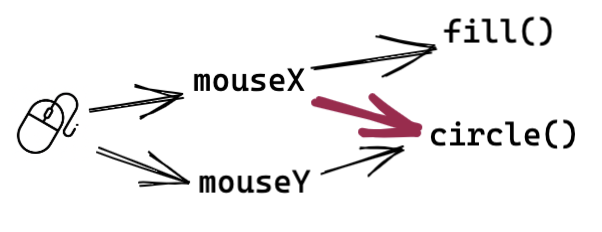
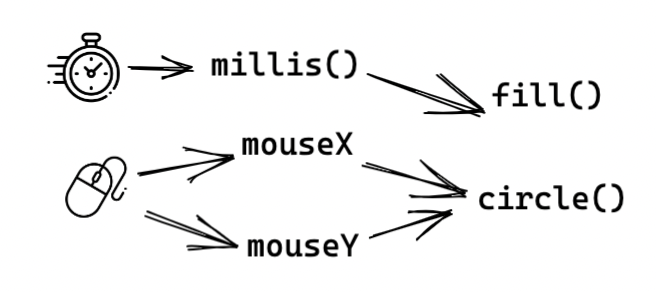
One way to visualize what is happening is to draw a data flow diagram. The diagram on the left shows the sketch with the variable x. This variable gets a value when we assign to it: x = 10. The diagram on the right shows what happens when we use mouseX. Each time before draw() is called, it gets a new value by reading the position of the physical mouse (or trackpad) that is connected to the computer. (This is something Processing does, so it happens automatically so far as your sketch is concerned.) (This may remind you of reading the value of a potentiometer in an Arduino sketch.)

We could add more detail to this second diagram, to show all the values, and all the arguments to fill() and circle(). (We’ll omit background(), so it doesn’t get too crazy.)

(It generally isn’t a good idea to try to put everything into one diagram, and we’ll stop doing this now that we’ve seen this one example.)
Let’s add in mouseY and connect up some more values. Run the sketch, and interact with it. Hopefully, you’ll notice that (in the source code) we not only make use of mouseY for the circle position, but we also use mouseX a second time to drive the circle color.
void setup() {
  size(400, 400);
}

void draw() {
  background(220);
  noStroke();
  fill(mouseX, 0, 0);
  circle(mouseX, mouseY, 50);
}
What happens as you scrub the mouse across the canvas? If you look carefully, you may notice that the circles changes from black (on the left), to red (about 2/3 of the way to the right), and then stays the same color when it is positioned between 2/3 of the way from the left to the right, and 100% of the way from the left to the right.
Range and Domain
A note about range and domain. The range of mouseX is 0 (the smallest value it can have) to the canvas width (its largest possible value). [The largest value is actually canvas width - 1. And we can write this in code as width - 1. width is another variable that Processing declares.]
The domain of fill() is 0 to 255. [If you use colorMode() you can change this.] Processing happens to treat color values greater than 255 as though they were 255, so the color only changes until the mouse x position reaches 255; then it stays the same.
If we want to modify the range of mouseX to match the domain of fill(), we have two alternatives:
float red = map(mouseX, 0, width - 1, 0, 255);
float red = mouseX * 255.0 / (width - 1);
Follow either of these by:
fill(red, 0, 0);
The first of these uses the map() function to re-scale a value from one range (0…width-1) to another (0…255). The other uses arithmetic functions to do the same thing. You can think of them as fixing the red arrow so that the output from mouseX matches the input to fill(). (Question: Why didn’t we need to do that for circle()?)
You may have done this on the Arduino, to connect a sensor input (range = 0…1023) to an output (domain = 0…255).
Note: mouseX is multiplied by 255.0
Time and Animation
mouseX is a way of getting information from the outside world into your program, so that it can respond (do something different when the world changes), and interact (participate in a cycle of response and display). The specific feature of the outside world it reads is the position of the mouse or trackpad.

Another feature of the outside world is time, and the way to get information about it is to use the millis() function. This returns the number of milliseconds (thousands of a second) since the sketch started running.
Note that millis() is a function, while mouseX is a variable. The immediate consequence is that you have to use parentheses () after millis(); use mouseX without following it by (). The other difference is that, within a call to draw() , mouseX will have the same value each time that you access it. (Processing sets its value, and then calls draw().) millis() can return a different value each time it is called.
Let’s drive the color of the circle from millis(), instead of from mouseX:
void setup() {
  size(400, 400);
}

void draw() {
  background(220);
  noStroke();
  float red = map(millis(), 0, width - 1, 0, 255);
  fill(red, 0, 0);
  circle(mouseX, mouseY, 50);
}
What happens? What do you expect to happen?
The color ought to change from start out dark, and become more red. And it actually does this – but so quickly you might miss it. map() is mapping from a range of 0…width-1, or 0…399. 399 milliseconds is 0.4 seconds. When you run the sketch, the color changes to red in the first 0.4 seconds, and then stays red.
What would be a reasonable range? Let’s say we want the color change to take ten seconds. This is 10 * 1,000 = 10,000 milliseconds. So replace the line float red = … by the following:
float red = map(millis(), 0, 10 * 1000, 0, 255);
Note that in Processing, we can’t use commas in numbers – so we couldn’t write 10,000, we would have to write 10000 which is difficult to read (how many zeros are in it)? We can however use the computer as a calculator by writing 10 * 1000 and letting it do the math. This captures the design intent – this is 10 seconds.
Image Credits
Illustration icons made by Freepik from www.flaticon.com