p5.js IMU Workshop
During this workshop, you will start from a p5.js starter template and connect it to data from an inertial measurement unit (IMU).
Goals:
- See an example of using code from a JavaScript library.
- Gain more familiarity with functions and variables.
- Use
console.logto inspect data. - Write code that uses sensor data sent over the network.
- Get started on the physical computing aspect of your project.
A. Create a new p5.js project
In this section, you will create a project folder that contains the index.html and sketch.js files needed to run a p5.js sketch. These steps are similar to the Setting up an IMU workshop, but Visual Studio Code is already configured.
- Open a terminal window. Use
cdif you need to move to the directory where you want to create the project. Runningcdwithout a path moves to your home directory. - In the terminal, run
git clone https://github.com/osteele/p5-module-template.git imu-workshop. This command creates a local folder namedimu-workshopwith the files for a minimal p5.js sketch. - In Visual Studio Code, open the
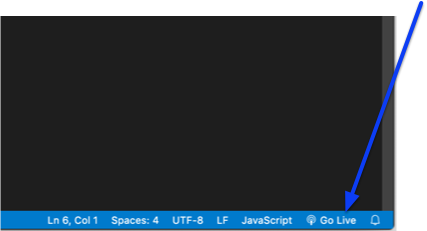
imu-workshopfolder. - In Visual Studio Code, click the “Go Live” button.
- Modify
sketch.jsso that something appears on the screen.
B. Subscribe to sensor data
We will use the imu-tools npm package to receive IMU data from a network server. Add the package to the project, then configure the server address.
- Follow the instructions on the imu-tools project page to add the package to your project.
Note: You will need to add lines to both index.html and sketch.js.
Note: Complete the instructions in both the Usage and Connection Settings Control Panel sections of the imu-tools project page.
-
Enter the MQTT connection settings from this page.
-
Verify that data is being printed to the JavaScript Console. (In Chrome: View > Developer > JavaScript Console).
C. Examine the data
Each sample from the device is printed to the JavaScript console. This confirms that data is arriving, but the continuous output makes a single sample difficult to inspect.
We will fix this in these steps.
These steps describe the intended behavior without giving you code to copy. Write the JavaScript yourself so that you can practice applying the same skills elsewhere.
data => console.log('sample', data)is an anonymous function, which means it has no name. Replace it with a named function calledhandleSensorData. Usefunctionto define it with adataparameter, then callconsole.login the function body.- Introduce a global variable (a variable that is defined outside of any
function), that keeps track of whether this is the first time thathandleSensorDatahas been run.- Pick a name for the variable, and use a
letstatement to define the variable and initialize it tofalse. - Modify
handleSensorDatato change the variable’s value totrue.
- Pick a name for the variable, and use a
- Finally, add an
ifstatement to the function so that it only runsconsole.logthe first time it is run. - Now, the sketch should only print the sample data once. Inspect this value in the JavaScript console.
D. “Zoom into” the data
The sensor data is a JavaScript object with several properties. Many of these properties are arrays. In this section, you will read one property from the object and one value from an array.
- Modify the call to
console.logto print just the orientation data. (The orientation data is in the property namedeuler.) Move the IMU, and observe how this value changes. - The value of the
eulerproperty is an array of yaw, pitch, and roll. Modify the code in the call toconsole.logto print just one of these.
E. Use the sensor data in the sketch
To use the IMU data in a sketch, add another global variable. The function called by onSensorData stores sensor data in this variable, and the draw function reads it.
- Choose a variable name. Define a global variable with this name and initialize it to
null. This value means that no sample has arrived yet. - Modify
handleSensorDatato set this variable to the latest sample data. (You can decide whether the variable is set to the entire sample, just the orientation array, or a single value from the orientation array.) - Modify
drawto make use of the value. The drawing should do something that depends on the value.
Suggestion: Use the p5.js rotate function to rotate a shape or image according to the value of one of the sensor readings. You will run into two challenges: (1) The sensor’s Euler angles are in degrees, while the rotate function expects angles in radians. (2) p5.js rotation is around the upper left corner, at (0, 0). In order to rotate around a different point, you will need to use the translate function.
Note: Code that attempts to access the data may produce an error or unexpected results if it is run before the first sample arrives from the IMU. You can avoid this issue by testing whether the data is null; for example: if (…variable name… !== null) { …your code here… }.